Overview
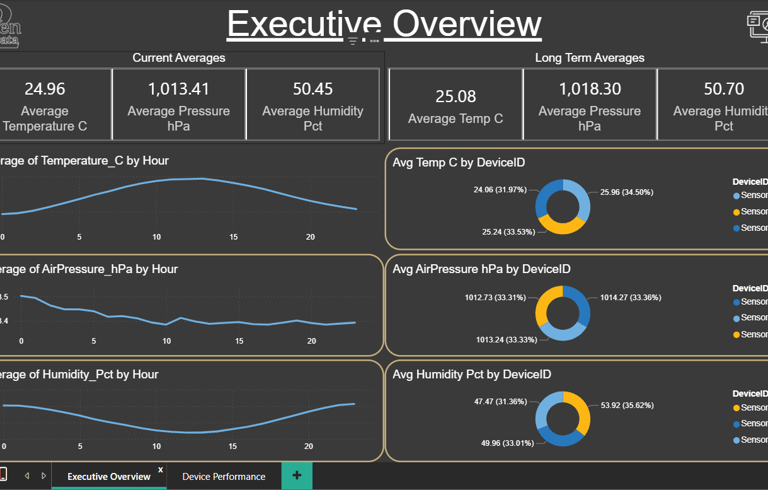
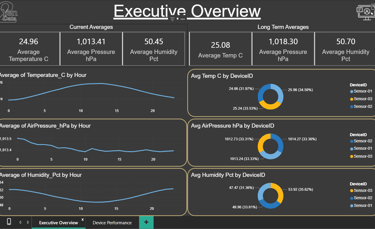
This dashboard uses generated sample data to demonstrate a scalable model that connects to IoT sensors for temperature, air pressure, and humidity. It can be expanded to include more devices and sensor types as needed
Daily Overview Page
The daily view shows a line graph of the current day and proportion charts for each device, making it easy to compare device performance and spot unusual readings
Device Performance Page
The performance view presents long-term data with KPIs and a detailed line graph, helping you analyze trends, check device health, and identify performance issues