
Fraud Analysis Report:
Summary:
Dataset Overview
This analysis is based on a Kaggle e-commerce fraud dataset containing over 1.4 million transactions recorded between January 1 and March 31 2024. The report is divided into four sections: Fraud Overview, Fraud Over Time, Fraud Revenue, and Account Profile. Each page maintains a consistent set of key performance indicators (KPIs) along the top, enabling comparisons of how different dimensions influence overall fraud metrics. Navigation buttons are located in the lower-left corner, and each page includes a reset control for quick filtering resets.
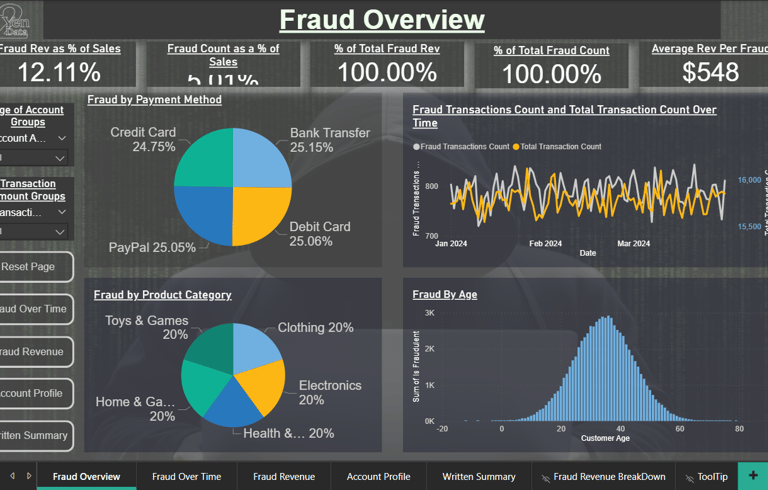
Fraud Overview
This section presents the primary metrics of the analysis. Fraudulent activity shows limited variation across payment methods and product categories, indicating these variables are not major predictors. However, fraud frequency increases with higher transaction amounts, suggesting value-driven targeting. Fraud by customer age follows a roughly normal distribution. The most significant correlates of fraud appear to be account age and transaction amount, both of which are explored further through interactive slicers on subsequent pages.
Fraud Over Time
This section examines when fraudulent transactions occur. Fraud levels remain relatively stable across the three-month period but reveal clear intra-week and hourly trends. The hourly chart divides the day into 24 segments, allowing users to identify peak fraud activity times and potential operational vulnerabilities.
Fraud Revenue
Here, both fraud count and revenue are segmented into ten transaction-value groups, highlighting where financial losses are concentrated. The analysis also includes the number of items per fraudulent purchase, providing context on how fraud behavior scales with quantity.
Account Profile
This section provides a behavioral snapshot of fraudulent accounts. Younger accounts exhibit higher fraud rates, reinforcing account age as a dominant risk factor. Fraudster ages are evenly distributed with a modest peak in the mid-thirties. The comparison of billing and shipping addresses shows minimal impact, and fraud appears evenly distributed across devices (desktop, tablet, and mobile), suggesting device type is not predictive.

With this dashboard you can:
Protect revenue with smart fraud monitoring
See key risk segments clearly
Align teams using accurate metrics
Improve outcomes with faster intervention
Unify your fraud signals, rules, and anomalies in one place—so teams know what’s safe, what’s suspicious, and where immediate action is required.
Get In Touch:
Address:
Plot 11c, Map Sheet 06,
Xóm Trung Thành, Xã Mông Hóa,
Hòa Bình City, Hòa Bình Province,
Vietnam
Contacts
+84 81 880 2787
admin@tuyendata.com